Roadmap and Demonstration
Roadmap
| Phase | Goal | Exit criteria |
|---|---|---|
| v0.1 Lab PoC | Show controlled LLM execution | Request → diagnostic path → tool calls → answer + run details. PROTOTYPED |
| v0.2 Stabilized run | Stabilize one financial and one operational scenario | Demo can run without hand-substituting the result. PROTOTYPED |
| v0.3 Document evidence layer | Strengthen evidence through RAG | Answer can refer to documents/chunks. PROTOTYPED as a direction |
| v0.4 Tool Registry v0.1 | Move hardcoded tools toward a registry | Tools described through a manifest; separate tool-server. PROTOTYPED as an initial concept |
| v0.5 Executive report | Move from chat answer to report artifact | Executive brief + signal cards + evidence appendix. NOT IMPLEMENTED |
| v0.6 Cross-domain scenario | Show finance → delivery → ITSM → PMO chain | Prototype can explore a planted cross-domain cause. EXPLORED, NOT FULLY STABILIZED |
| v1 Real MVP | See below | Not reached |
Next step toward MVP
To become a real MVP, the prototype would need:
- multi-turn session state;
- correct handling of clarifying questions;
- continuation of the same analytical run;
- persisted run/session context;
- more formal tool registry schema;
- evaluation harness;
- read-only connectors to realistic enterprise data sources;
- authentication and authorization model;
- audit and observability layer;
- demo scenarios with measurable expected outcomes.
The current work is a technical PoC / working prototype. It is not yet a real MVP.
Demo Scenarios
Demo scenarios below are single-turn analytical requests on synthetic data. They show the intended flow, not a complete conversational product.
Financial Performance Diagnosis
Example question:
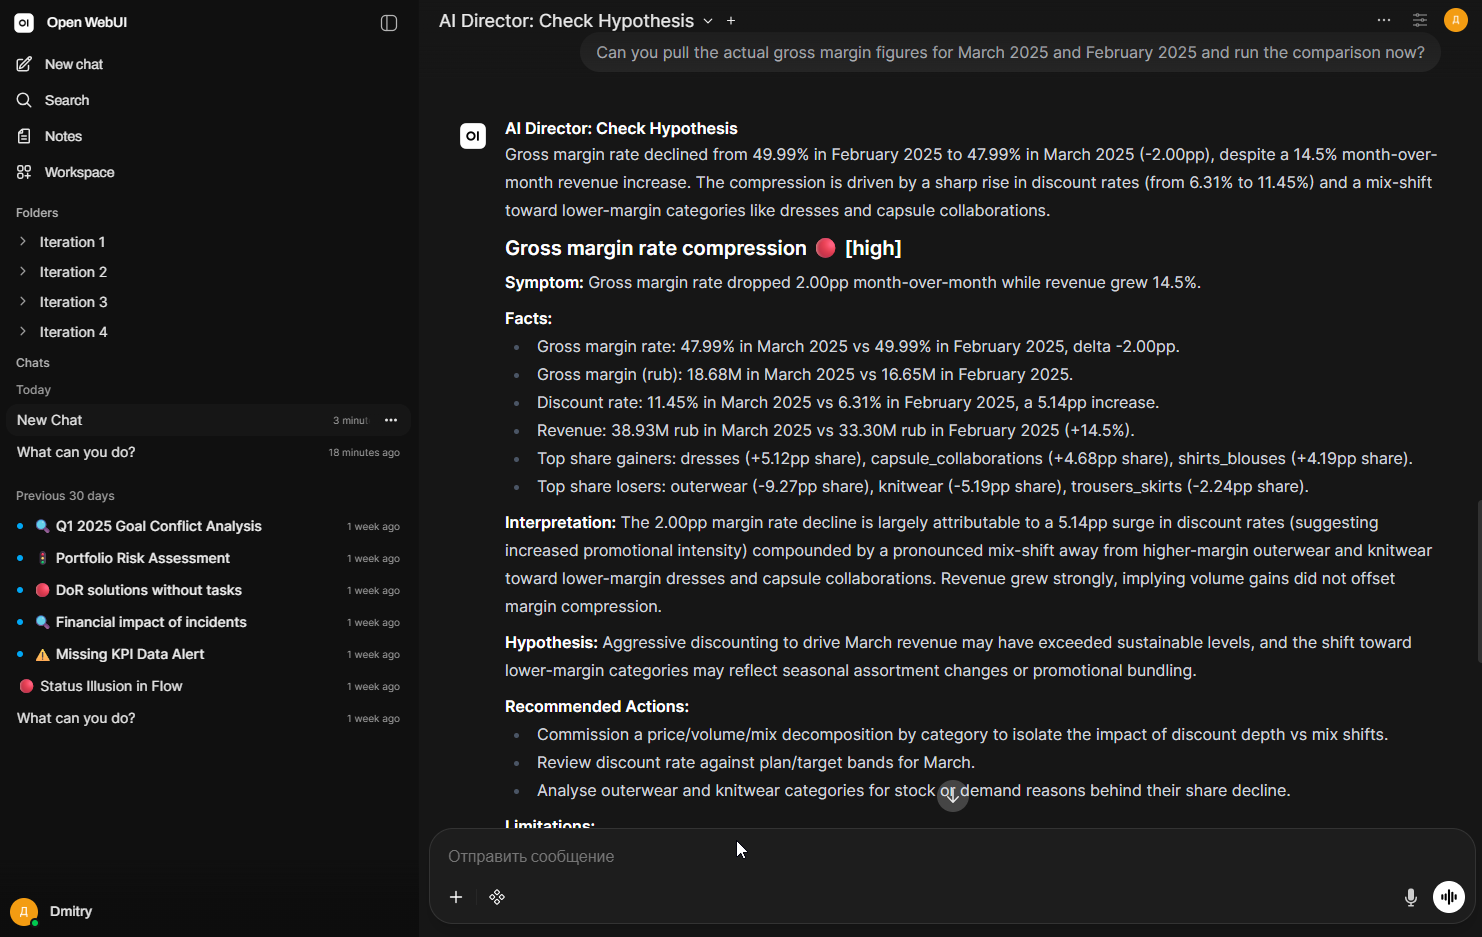
Why did gross margin drop in March?
Expected prototype flow: route into a financial diagnostic path, call metric tools for gross margin, revenue, discounts, COGS, and product mix, then produce a structured summary with evidence and limitations.
Operational / KPI Anomaly Diagnosis
Example question:
Why is time-to-market unstable while local team KPIs look normal?
Expected prototype flow: route into an operational diagnostic path and inspect delivery, PMO, ITSM, meeting decisions, and related evidence for cross-functional bottlenecks that are not visible in isolated KPI dashboards.
Cross-Domain Management Hypothesis
Target scenario:
Identify the top problematic projects, explain the selection criteria, describe the issue for each project, and prepare a meeting agenda for product owners.
This scenario shows the intended product direction: not only retrieving delayed tasks, but turning structured and document evidence into a management-ready diagnostic brief. It was explored as a target demo-flow and still needs stabilization of cross-domain linkage and evidence quality.
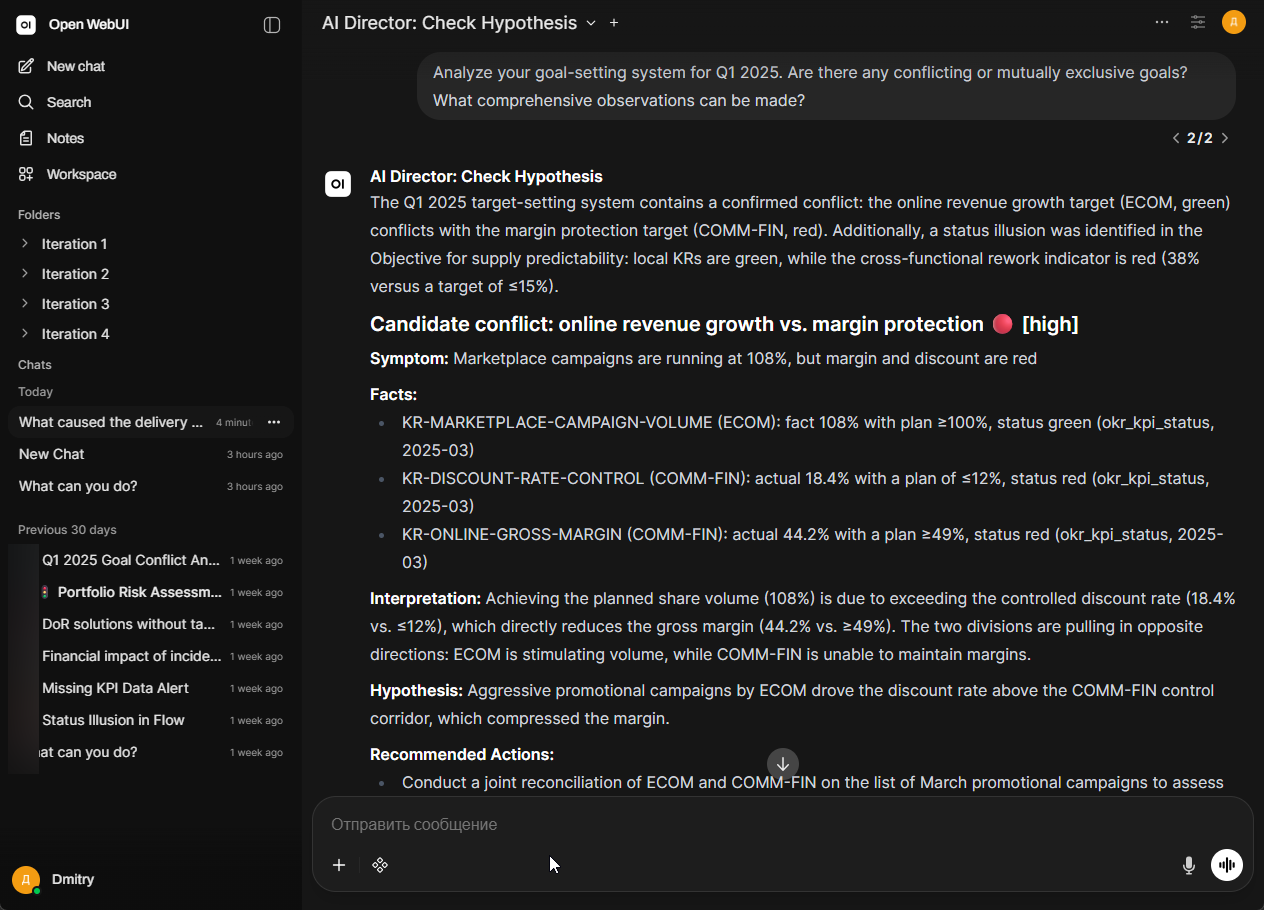
UI Screenshots
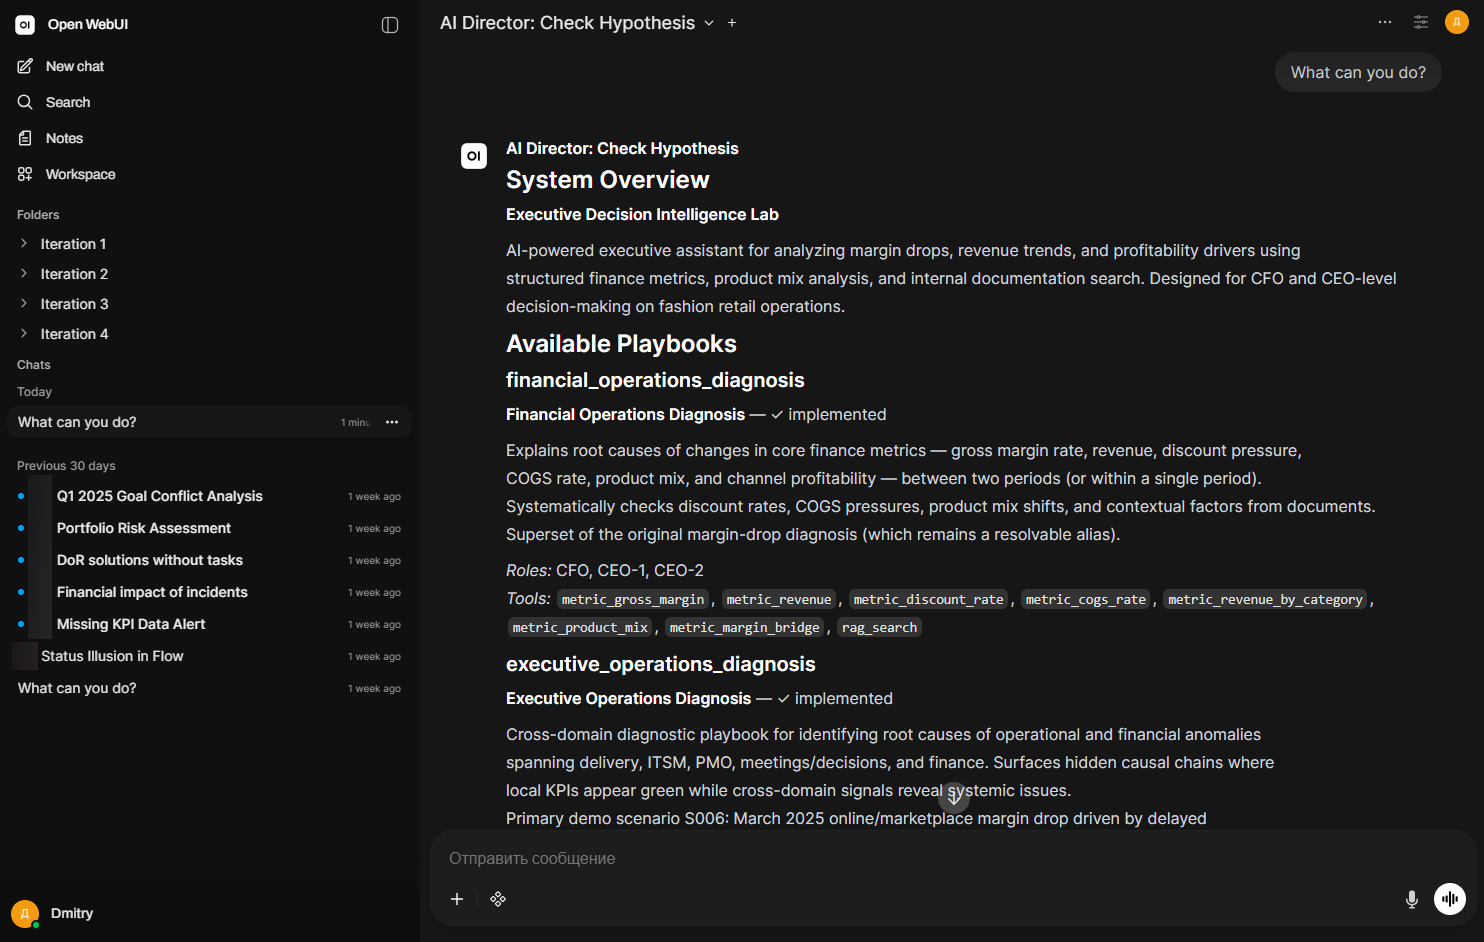
"What can you do?"
Financial diagnostic path: gross margin drop hypothesis
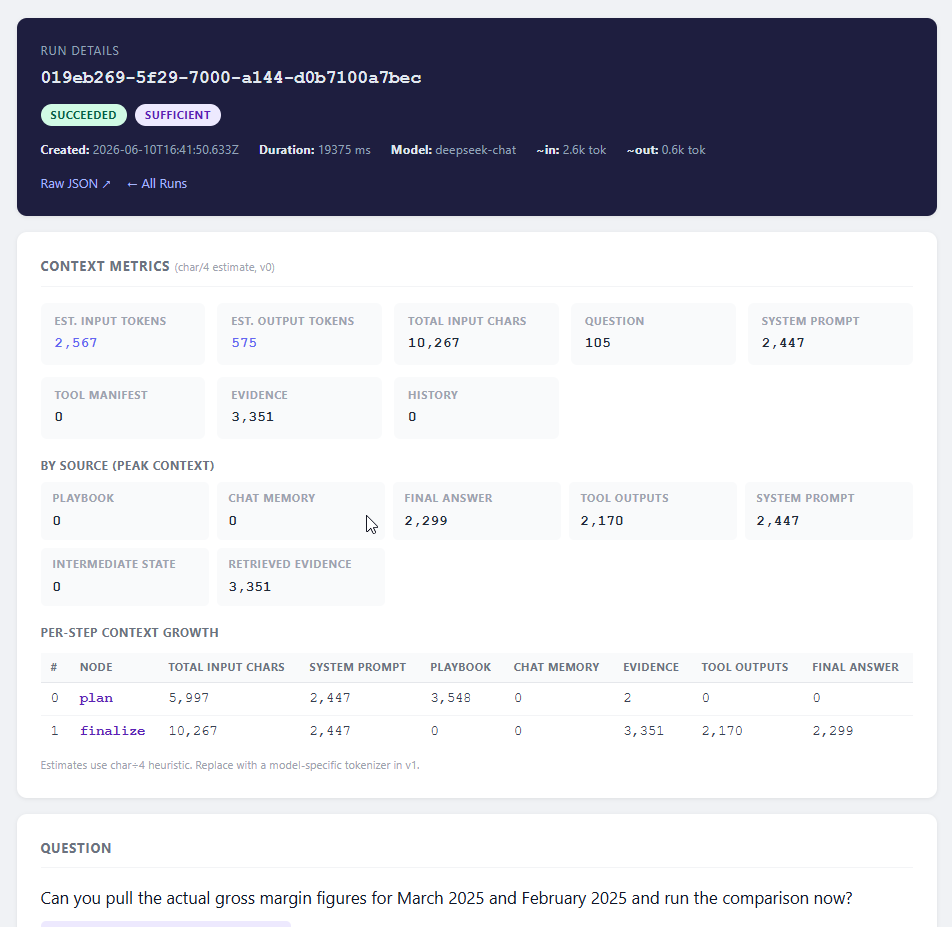
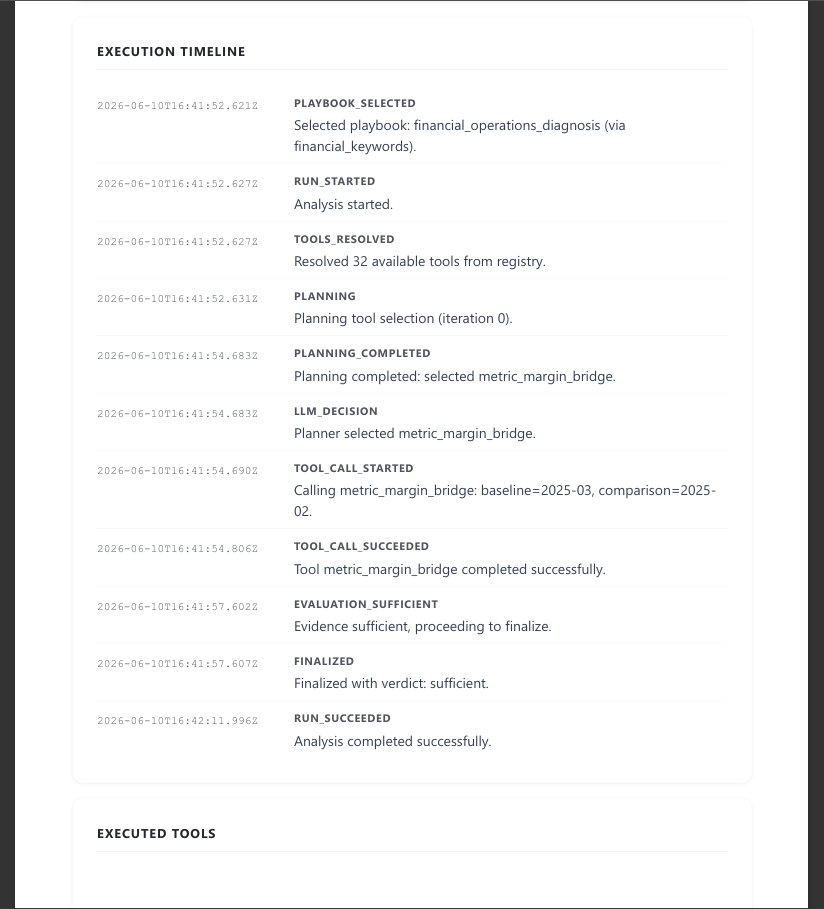
Operational diagnostic path: KPI anomaly
What This Demonstrates
This project demonstrates the ability to take an ambiguous enterprise AI idea and turn it into a constrained, demonstrable prototype.
It shows:
- understanding of enterprise AI risks;
- controlled LLM execution instead of free chat;
- separation of chat UI and execution layer;
- tool-mediated analytics;
- evidence-backed response design;
- execution trace as a trust/debugging mechanism;
- ability to build a working prototype quickly;
- ability to honestly document limitations.
The core value is not "using an LLM". The core value is designing a system where AI reasoning is bounded by architecture, evidence, tool contracts, and auditability — and stating clearly what the prototype did and did not implement.